mapz.com offers professionally designed city, regional and country maps covering the whole world for use in online media and print applications.
You can download our maps immediately for further editing on your computer, or add them to websites and applications using the optional mapz API. They are available in screen and Retina display versions, as well as high resolution for print applications.
Our service offers the perfect file format for every application: Depending on the type of map, you can choose between editable PDF files, the widely used graphics formats JPG and PNG, or Photoshop files with a separate text layer, in 200 and 400 dpi resolutions. The largest download format is 1,750 square centimeters, or approximately 42 x 42 cm.
We also offer embed codes, an easy way to add interactive maps to your website, and a powerful API for database-supported retrieval.
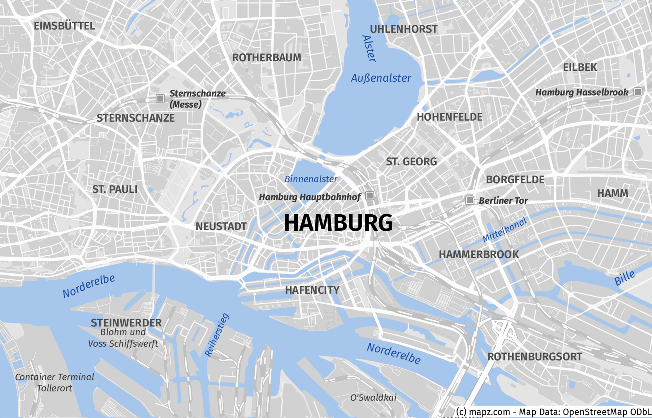
mapz.com lets you choose the ideal map for your project from a variety of types. Our map material is global and, in metropolitan regions, includes detail down to the level of building outlines. Various styles offer variety in terms of both map aesthetics and content density. That lets you easily fulfil a broad range of requirements, for everything from detailed maps to info graphics. The type of map that best meets your needs depends on your goals and, not least, personal taste.
Launch the map editor. The Maps menu gives you access to global map material with two different designs and different content densities. Our “Multicolor” maps have a traditional, four-color design, as used in traditional cartography.
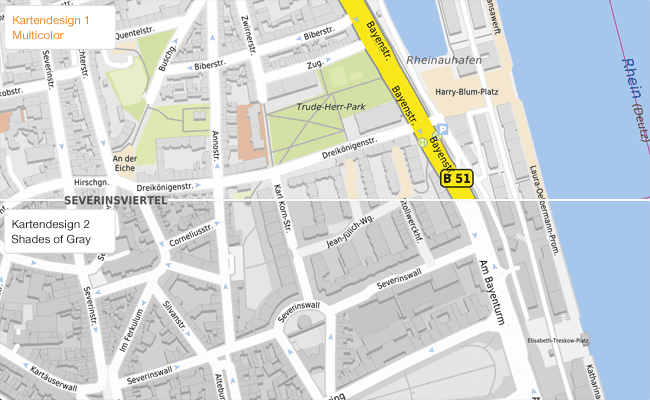
The “Shades of Gray” map design features less color and content, and is ideally suited to infographics and thematic maps. Both map designs are also available in a “blind” version; without any labels. It is easy to add the labels required for your project using our text and drawing tools.
All our base maps use data from the OpenStreetMap project. They are designed by professionals of Kober-Kümmerly+Frey.
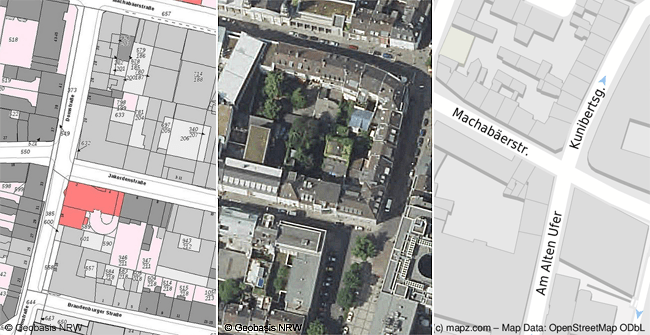
In addition to the world wide maps you have access to official aerial photographs or official real estate maps (most of them covering Germany).
We are happy to integrate other map sources that are (here things get a little technical) available as a WMS- or TMS-Service in EPSG:3857. Please feel free to contact us to discuss your needs. ››› Contact us
You can view all our maps without registering. Samples of all our file formats are available from the Map design and demo files page, which allows you to assess their quality before you register. We only require registration for access to high-resolution downloads and the drawing tools.
The registration process only takes a moment, and is free. The initial registration only involves entering a valid email address and password. After a few seconds, you will receive an email that allows you to activate your account. If you can’t find the email in your inbox, please check your spam folder. We always send our activation links from the address service@mapz.com.
The map editor gives you access to all the core mapz.com functions. Use Maps to choose the required map section, and Draw to add pictograms from library of markers, along with text, lines and areas. Then Download the map data to your computer.
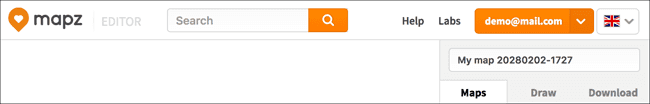
Good to know: as soon you log in and open the editor, the current map view is saved automatically. That ensures that your settings are not lost when you log out of the system, so that you can continue editing your map at a later time.
The map type currently selected, all the objects inserted using the drawing tools and the selection set in the download menu are saved.
You can choose the name of the saved file using the input field directly below your email address. The default file name is My map with a time stamp.
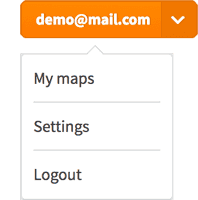
When you want to access a saved map, select the menu item My maps by clicking your email address.
The mapz.com editor includes a search function, which you can use to locate a street address, in the same way you would use the map portals of the major search engines.

In many metropolitan regions, the search results will show the exact house number. You can identify the type of search result by the color of the marker. A red marker indicates the exact location of a specific house. A blue marker indicates that the house number could not be located. Instead it shows the street or town/city, but not the exact location of the house.
Where required, you can use the drawing tool to move the marker to a different location, use a different marker design or remove the marker altogether.
If your search is unsuccessful: it can happen that an address is not found, although the location is correctly marked on the map and also labeled. This is usually due to an incomplete or incorrectly recorded database entry in one of our sources. In this case, try to keep the search query more general.
For our search function, we use data from OpenStreetMap, Geonames, Natural Earth, OpenGeoCode, Postcodes.io and numerous other sources. The database is continuously growing, and thus the search results are also continuously improving.
The mapz.com search function allows you to add building outlines and borders to a map, and highlight them, automatically.
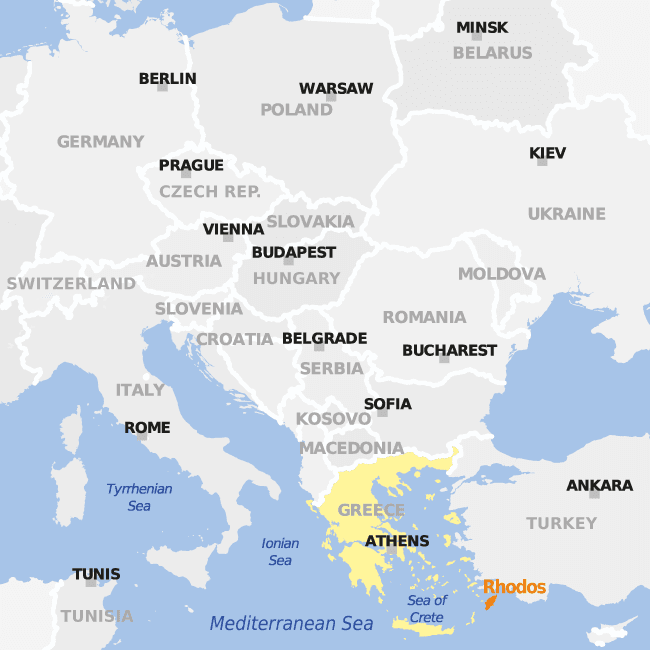
Then you can change the color and form out the outline as required. In this example, we have automatically added and colored Greece and Rhodes.
To add an object: carry out a search. For example, you can find the contours of continents and countries using the two-digit ISO country code. Then use the Draw function in the search result bar to edit the outline as required.
Here is an overview of search terms for objects that can be added to maps automatically, if they are available for the respective target area in our database:
DE for Germany or FR for France. A complete list is available here.NRW Arizona Saxony BavariaCologne San Francisco Berlin HamburgManhattan Altona Bockenheim Prenzlauer Berg50677 for Cologne 5067750 for Cologne area 505 for region 5Messe Berlin or Olympia, LondonWilly-Brandt-Straße 1, 10557 BerlinCologne Cathedral or United States CapitolPariser Platz or ViktualienmarktZoo Berlin Phantasialand Englischer GartenIt is not possible to locate and mark every object using the search function. However, our database is growing constantly, so it always worth experimenting.
In our PDF files, all vector elements of a certain type have an individual color value, which can be used to make selections. This method (selection by color) allows content elements of a specific type to be selected and assigned to separate layers using software such as Adobe Illustrator. That lets you amend the colors of motorway networks, built up areas or pictograms, and remove groups of superfluous items from the map.
Use the following steps to make a selection in Adobe Illustrator:
Horizontal elements retain as line text elements, so they are fully editable. Written elements that are aligned with pathways behave differently: for technical reasons, they are presented as a number of fragments, so they take longer to edit.
We use the free Fira Sans family. You can download the font at: fonts.google.com
The mapz function Draw → Upload elements allows you to include and interactively display external data sets in a map image. If you have the geographical coordinates of locations, line elements or areas in a standard format – such as those generated by GIS systems, or from a publicly available source – they can be imported in just a few minutes.
mapz supports import and export of GeoJSON and adapted CSV text files. For detailed instructions, see Interactive maps and data integration.
Good to know: double clicking zooms in on the selected area. You can also use the plus and minus buttons to zoom in and out. To change the selection, click and hold the mouse button and drag the map. To enlarge an exact area, selected using your mouse, hold down the shift button as you drag.
The linear scale at the bottom left of the main window always displays the current scale and zoom level of the map section shown.
Use the “Share” function to send maps to friends and colleagues by email, or via social media portals. Click the “Share” symbol on the left of the page, below the zoom button. Then copy the permalink into an email, blog entry or tweet. Opening the link displays the map section you were viewing when you generated it. The viewer does not have to register to view the map.
If you have added markers, lines, areas or text to the map using the drawing tools, then those elements will be shown when the map is opened. If you amend or add elements, then the viewer will see the updated version the next time they click the link.
Important information for teams: the recipient can use objects added to the map in their own projects. If they add objects or change the map, they can send you an updated permalink, allowing you to view the current version of the map. That allows numerous users to work together more effectively using tailored maps.
When you switch to the Download tab, a selection frame with edges corresponding to the defined paper format is shown over the map. A DIN A4 format is shown by default, but individual paper formats and, therefore, different frame proportions can be selected. The map made available for download at a later time therefore fits the pre-determined paper format and not the (possibly scaled) selection frame.
The selection frame can be moved over the map content with the mouse until the selected map section meets your needs. The drag points at the corners can also be used to enlarge or reduce the size of the section, which makes selection easier when working with large formats.
Our “Multicolor” and “Shades of Gray” map designs are dynamically created and labelled when the user clicks “Download map”. However, the zoom level shown in the selection frame gives you an impression of the level of detail that will be included when the map is generated – because of the additional space, the same selection from a city map will include far more detail and labelling in A3 format that in a more compact A5 format.
If the required selection allows it, we recommend that the zoom level in the selection frame is matched to the zoom level shown at the bottom left in the editor to give an approximate impression of the resulting map on screen.
You will also be shown a preview of “your” map when you click “Download map”, giving you the opportunity make further adjustments or cancel the download.
If so, the following tips may be helpful to you (but we need to elaborate a bit here for better understanding):
First of all, we are asked time and again why some maps differ from the screen view when downloaded (and thus already in the preview). The download frame marks the borders of the desired map, but in many situations this is only proportionally reduced or enlarged and not 1:1 according to the image format preset on the right under "Download" (imagine you want to draw a large frame of e.g. 40 x 40 cm on a small laptop, at the latest then the frame would otherwise protrude from the screen in one or more directions). A download can therefore only be identical to the screen view if the view zoom level also corresponds to the download zoom level (the zoom level information at the bottom left of the map image must therefore be identical to the information in the center of the download frame).
A zoom level also always covers a range of scales, so that maps generated in Zoom 16, e.g. of Cologne, could have scales between 1:3,700 and 1:8,600 (which then, strictly speaking, even more vary vertically within the respective map section).
By default, a map download always refers to the map format defined on the right in the "Download" area on the basis of cm specifications. A mapz map is also always created just at the moment of the download according to the format entered there, unlike the previous screen view, which is based on pre-produced "images" (map tiles) for the sake of speed. Thus it becomes clear that the screen view and the download map (including preview) can already differ from each other for technical reasons.
If one were to download different map sections at the same zoom level (in different scales), this would not only result in content that exactly matches the scale of the map section, but also in font sizes that differ from map to map. Of course, this has the advantage that the maps generated in this way are largely identical to the screen view. Close to the next higher zoom the labeling of one and the same federal road appears much larger, close to the next lower zoom, however, much smaller at the same time. This is the default behavior:
Dynamically generated. Your map is downloaded exactly as it appears in the browser. No elements are omitted. If you save multiple maps at the same zoom level, they may have different font and icon sizes.
However, such results look unattractive as soon as a series of maps is displayed next to each other. Here, one would wish for a uniform appearance with identical font sizes. To meet such requirements, the download settings of your mapz account can be changed from "Standard" to "Map series". In this setting, the maps are generated in the respective displayed scale, but standardized with regard to the font and symbol sizes. In this process it can happen that e.g. street names displayed in the screen view are no longer included in the download or vice versa. This is what we call a
For map series with unified font size per zoom level. Your map is created using content and font sizes that we pre-define uniformly for each zoom level, so that fonts and icons from multiple downloads generated at the same zoom level match. If there is not enough space for individual elements in the process, they could be omitted.
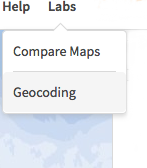
The Labs menu includes professional and experimental functions that require a certain level of expertise. We chose the name Labs because we are constantly developing these functions, and they may change at any time without notice.
The Geocoding function is in the beta phase. Use at your own risk ;-)
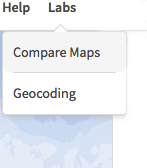
The Labs/Compare maps function allows direct visual comparisons of different types of maps.
As soon as you activate this function, the map screen will be divided, with the map you are currently editing shown on the left. Choosing another map from the map menu will display it on the right.
Assuming that the maps are of the same area, changes to the selected map section are applied simultaneously, so that both maps show the same area. If the maps show different areas, for example because you want to compare a map of Cologne with a map of Berlin, then each map can be moved individually; the movements are not synchronized.
To hide the second map, simply click Labs/Compare maps a second time.
mapz geocoding adds geocoordinates to postal addresses. You can download the location coordinates of up to 20 addresses free of charge as a CSV file per call-up and transfer them to your own systems or integrate them into mapz maps.
In order to assign more than 20 addresses you will need an API-key. Please feel free to ››› contact us.
The Embed function is mature and works without limitation. However, the embed codes provided may change slightly from time to time, without affecting the functioning of existing codes.
Our embedding function allows you to add interactive maps to your website. The embedded maps can be zoomed to different levels and show all the objects you have added to the map. For detailed instructions, please see our embedding tutorial.