Our update at the start of 2018 is packed with new functions and file formats, and a new map design – all with reduced tariffs and a new simpler licensing model. Our flat-rate and volume tariff customers are not affected.
Instead of EPS files, we now offer improved vector PDFs, along with raster files and Photoshop files with a separate text layer. The use of different fonts and our attention to detail mean our map labels now meet your needs even better.
Please note: The update will be carried out on Friday, 12 January 2018. On this day our service will be available very limited.
An optional add-on called Portfolio has turned our professional map download service into a web GIS system.
mapz Portfolio is a cartographic editing system that allows the recording, management and visualization of locations and areas on outstanding quality maps.
That means you can record locations, buildings and markets on our maps, along with the respective metadata (descriptions, metrics, image material or web links). The results can be filtered according to your requirements, and shared directly with your customers and colleagues or integrated into a website in the form of an interactive map or high resolution image.
The recording of areas and locations, including metadata, can be carried out manually using mapz Portfolio’s integrated drawing tools or semi-automatically using the built-in geometric search functions – many objects and areas, such as house addresses, the areas of federal states, municipalities, urban districts, postal codes, exhibition centers and important public buildings can be added automatically.
Metadata regarding locations is recorded using a previously standardized input screen, so that supporting staff can start recording data immediately, without the need for extensive training..
Along with manual and semi-automatic recording, locations, areas and the associated metadata can be imported from existing databases. Data is imported using a standard CSV exchange format (Excel) or GeoJSON files, which can be generated by all widely used GIS systems. Such data must include geographical coordinates. Alternatively, we offer imports of existing data, geocoding of datasets or the conversion of datasets into an appropriate format as a service.
A filter function allows the objects shown on a map to be limited to the dataset relevant to a particular project or area of interest. For example, the integrated free-text search function could be used to restrict the dataset to objects on a specific street, e.g. “Schillerstrasse”. Logical operators can be used to further narrow the search results, for example by searching for “Schillerstrasse + office rental”. Object classes, categories and statuses can also be defined and used to make rapid selections.
mapz Portfolio offers a diverse range of export options, which allow the further processing of recorded data using numerous applications. Exports take any filter criteria that have been applied into account, so large datasets can be used to rapidly generate numerous individual maps, each showing different information.
All the data recorded in Portfolio can be accessed for use by third party applications via our programming interface (API).
mapz Portfolio allows the creation of any number of themed maps (Portfolio A, Portfolio B, Portfolio C) to meet the needs of various departments (office, retail, commercial) or customer groups. The integrated user management system can be used to determine which users can view and edit a particular map.
mapz Portfolio is already in productive operation. Each customer is set up individually. Please feel free to contact us for a no-obligation online demo.
Our databases and the careful selection of content shown at different zoom levels are at the heart of mapz. They must be perfected before the design process can begin, and we are very proud that we have completely redeveloped the databases that form the technical foundation of mapz.com.
That has opened up numerous new possibilities and allowed us to improve the content and appearance of our maps. The style with the most content is “Multicolor Points of Interest”, which is why we will explain most of the significant changes using this style.
Our hand-drawn maps will no longer be available: The “Special purpose maps” section used to include hand-drawn maps from the Kober-Kuemmerly+Frey archive. These maps are outdated and no longer current, so we have decided to discontinue them for economic reasons. However, the “Special purpose maps” section still offers official maps and orthophotos from third-party providers.
As a general rule, we can only show objects that are included in our database and tagged appropriately. Experience shows that our data for Europe and urban areas worldwide is very good. Less populous areas generally have fewer recorded objects.
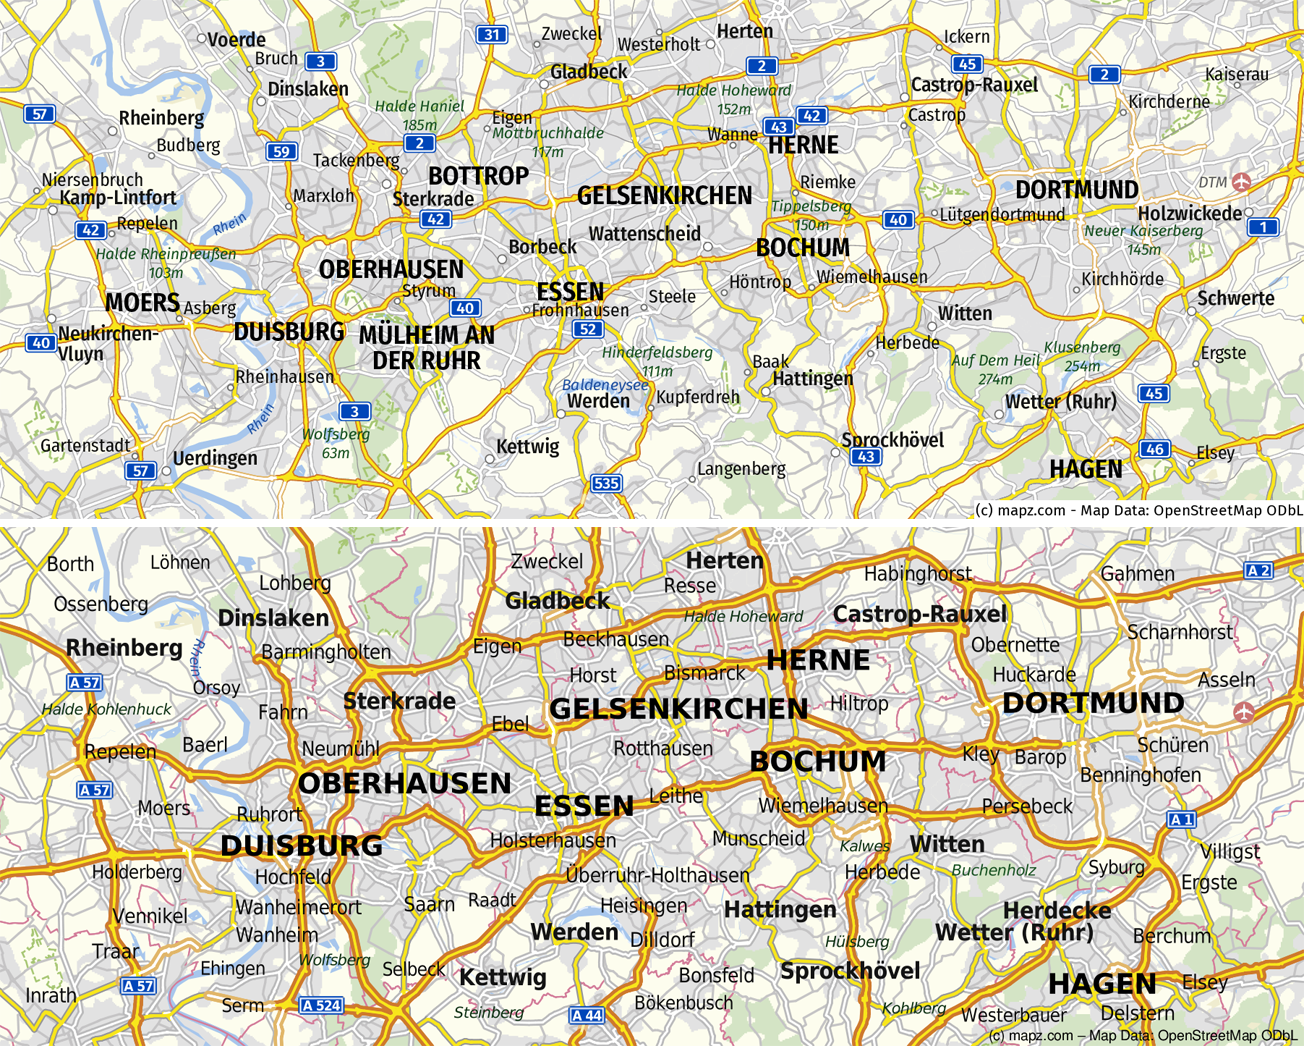
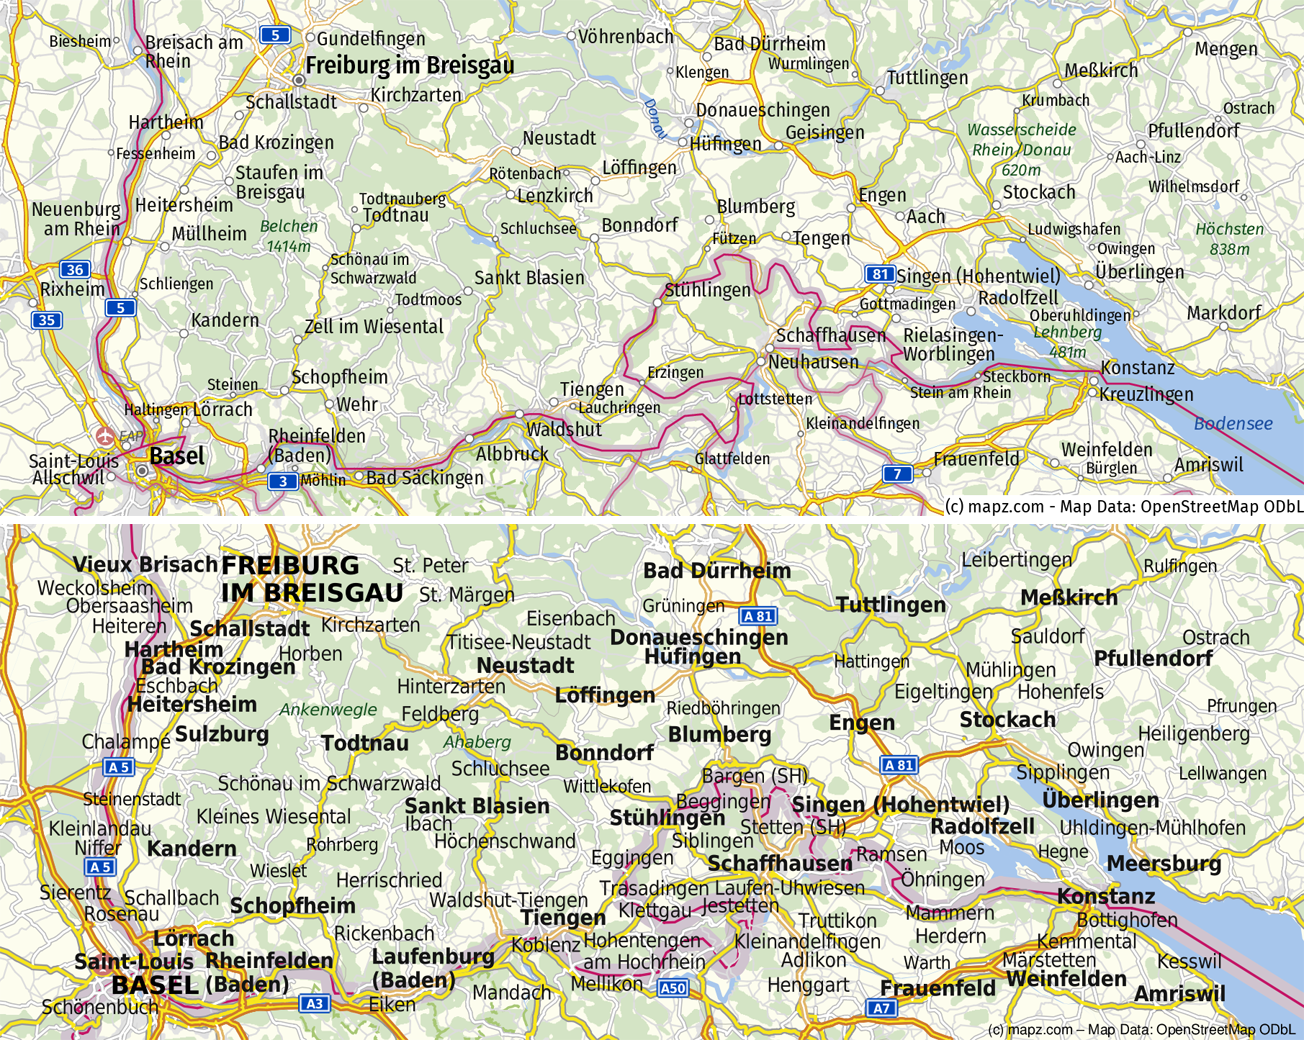
We have significantly reduced line thicknesses at all zoom levels. That gives the maps a more contemporary, less cluttered look.
We have also replaced the font used in the past, Dejavu Sans, with the open source font Fira Sans by Erik Spiekermann. It gives the map an even clearer and more nuanced look. You can download the free font at fonts.google.com.
The placement of freeway and highway labels now follows a new logic, which improves the completeness and distribution of labelling. The same is true of federal highway labels in urban areas.
Point locations are now shown in the smaller zoom levels and spatial assignment has been significantly improved.
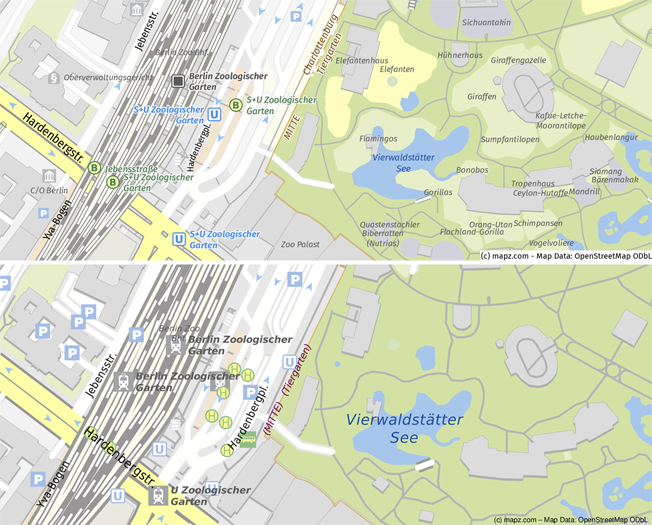
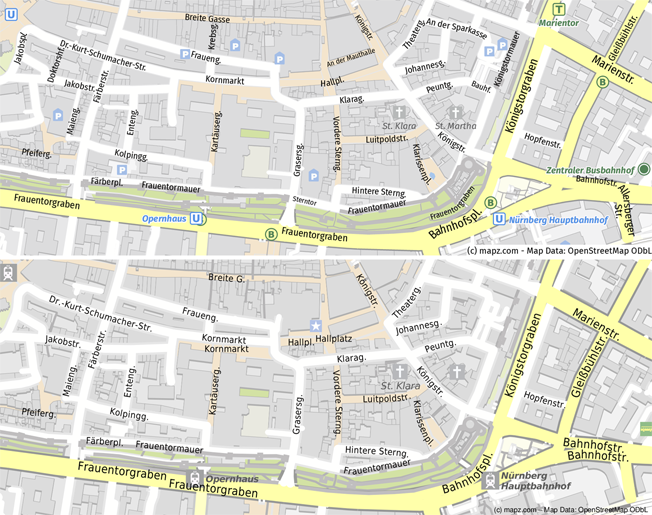
We now differentiate by category when displaying public transport stops. Train stations are shown as a grey square, tram stops appear as a green H in a bright yellow box, subway stations are depicted as a U in a blue box, bus stops appear as a green B in a bright yellow circle, while major bus stations are shown as a dark green circle.
Symbols no longer overlap: Our old system sometimes marked points of interest (e.g. churches) with two overlapping symbols, because they were included in our database as both a point and a building. Our new system filters out such duplicates and reduces overlapping text and symbols to a minimum.
Our newly developed system allows a more efficient labelling for which reason more objects can be placed on lower zoom levels.
A number of selected labels, e.g. the names of train stations and freeway exits, have been given a new contour to improve readability.
The variable placement of text allows more dense content, because it means more settlements can be labelled in a limited space.
New algorithms determine which objects (settlements, mountains) have the most regional relevance on a map. Those objects are given preference in the labelling process.
The labelling of elements such as mountain peaks, islands or company locations now takes into account their size and surrounding objects, so that, for example, only the highest mountains or largest objects in a particular area are labelled.
Transparencies: Our newly developed system allows for transparent elements and text. That means elements from lower layers remain visible even when they are covered by border lines or region descriptions (e.g. “Black Forest”).
Parking lots and parking garages are now differentiated on city maps. Numerous other POI signatures have also been amended and improved in the scope of the update.
The variable placement of text allows more dense content, because it means more objects can be labelled in a limited space.
We are saying goodbye to the good old EPS file. Instead we present our new vector PDF and layered Photoshop file formats. Both offer improved control over content: Vector PDFs are far easier to edit with Adobe Illustrator than the EPS files we used in the past, because much less text is transformed into paths. The new Photoshop files include a separate text layer, which lets you easily move or delete obstructive labels.
Our data offering has been restructured as follows:
The former EPS vector file format and raster PDFs will no longer be available.
In recent years, our focus has shifted from the pure provision of data to software as a service (SAAS). We will amend our tariffs and terms of use accordingly at the start of 2018.
From the date of the change, map downloads with a resolution of 100 dpi will always be free, regardless of how they are used. Make the most of it!
High-quality files with resolutions above 200 dpi will be significantly cheaper but will be subject to fees without exception. The embed function will only be available for paid maps and will move from the “Labs” section to “My maps”.
Our tariffs page shows the new price structure for the requested format (but please wait until the update is completed at Friday, 12 January 2018 to see the new price structure).
Our volume tariff and flat-rate customers are not affected. If you are currently using individual downloads but are interested in our special tariffs, please feel free to contact us! ››› Contact
Our new price structure:
|
|
The change to our rights of use is reflected by our amended T&Cs. The new T&Cs apply to all downloads from the date of the change.
If you are unsure which elements or combination of elements meet your needs, please feel free to contact us and discuss your requirements. Contact us. ››› Contact